Lightspeed eCom's Statistics give you the ability to analyze and review your online store's activity, better understand your customers and conversion rates, and gain insight into your store's transactions.
Viewing product statistics
- Log in to your eCom Back Office.
- Click Products in the left menu.
- Select any product. In the top left-hand side of the screen you will find statistics that describe the product, including:
- The currency selected in your store with the default price of your product and whether tax is included or excluded.
- Created: The date the product was created by an eCom store user.
- Edited: The date the product has most recently been edited by your eCom store users.
- Viewed: The number of times your product has been viewed by traffic on your site.
- Wishlists: The number of times your traffic has added your product to a user wishlist.
- Reviews: The average rating of your product, as defined by customer reviews on your eCom store.
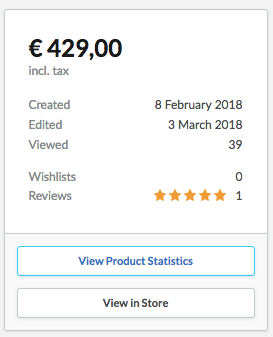
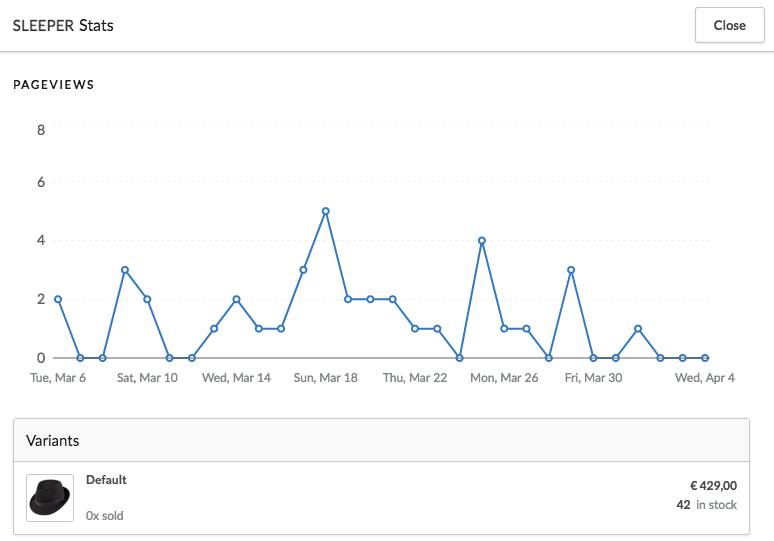
- Click View Product Statistics to see:
- A line graph of your page views over the last 30 days.
- The titles of the product's variants.
- The number of times your product's variants have been sold.
- The price of your product's variants.
- The stock level of each of your product's variants.
Viewing store statistics
- Log in to your eCom Back Office.
- Click Statistics in the left menu. The Statistics page shows you key sales data, including net and gross revenue, total costs, the total number of orders, the total number of visitors to your store, and more. The metrics are separated into 2 charts:
- Financials - This chart shows you financial data for your online store, including: your gross and net revenue, your total costs, the average value of orders, your average daily net revenue, and total revenue.
- Conversion - This chart shows you visitor data, including: the number of orders, the total number of unique visitors and pageviews, and the total percentage of visitors that have placed orders.
The number of pageviews are based on cookies. Cookies are small files that are stored on a shopper's device (such as a desktop or smartphone), when the shopper visits your online store. It's important to note that because the same visitor may visit your store multiple times in a given day, the number of pageviews may be higher than the number of unique visitors.
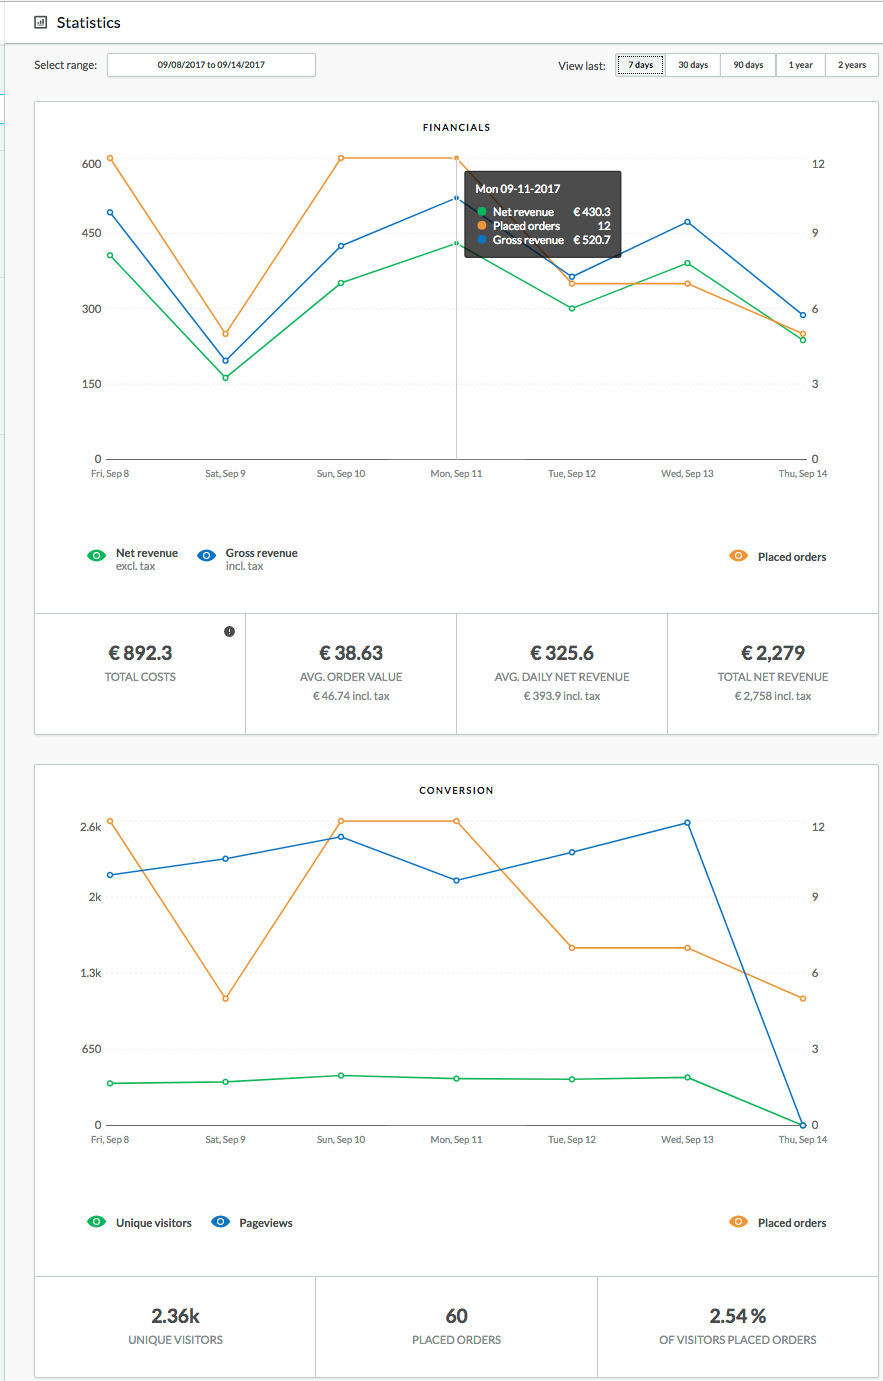
- By default, both the Financials and Conversion charts display data for the last 7 days (including the current day). If you want to see data for another date range, open the Select range drop-down and select a different date range:
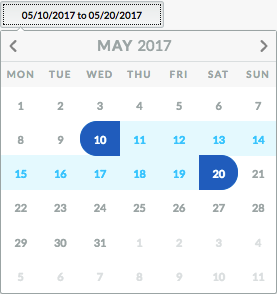
You can also select a preset range on the top-right:

To see a more detailed overview for a specific time period, use the slider to choose start and end points on the chart. The charts can display data for the previous 24 months (2 years).
Viewing metric descriptions
Lightspeed eCom shows the following metrics in the Financials and Conversion charts:
| Metric | What it shows |
| Placed Orders | Lightspeed eCom counts a purchase as a placed order when a quote is converted to an order, either via Quotes in the Back Office or when a shopper confirms that they will purchase via your store's checkout. An order does not need to be paid to be counted in this metric.
Lightspeed eCom dates the placed order according to the day when the order was converted, based on the timezone of your Back Office. If a placed order is cancelled, Lightspeed eCom automatically removes it from the total count. |
| Gross Revenue | The gross revenue metric is the sum of all your sales for the time period you are viewing, including all taxes and any additional costs, such as custom field costs, shipment costs and payment costs.
Lightspeed eCom adjusts the gross revenue metric based on the date an order is placed. If a previously paid order is converted to not paid or if a Credit Memo for the same order is added, Lightspeed eCom automatically removes the order from the gross revenue calculation. |
| Net revenue | The net revenue metric is the sum of all your sales for the time period you are viewing, including any additional costs, such as custom field costs, shipment costs and payment costs, but exclusive of taxes.
Lightspeed eCom adjusts the net revenue metric based on the date an order is placed. If a previously paid order is converted to not paid or if a Credit Memo for the same order is added, Lightspeed eCom automatically removes the order from the net revenue calculation. |
| Total costs | The total costs metric is the sum of the cost price of each product variant in paid orders, provided you've set the Cost price for variants in your product inventory.
Lightspeed eCom adjusts the total costs metric based on the date an order is placed. |
| Unique visitors | The total number of visits from each unique IP address. The total may not correlate with other analytics platforms’ measure of visitors. |
| Pageviews | The sum of the number of times a page on your online store was viewed within the specified time period. |
| Average Order Value | This metric includes the sum of net revenue divided by the number of placed orders in the time period you are viewing.
The average order value metric gives you insight into how much customers are spending during a given time period, and can help you fine-tune your pricing policies and discount offers. Lightspeed eCom shows you 2 amounts: one with taxes included and the other with taxes excluded. |
| Average Daily Revenue | This calculation includes the sum of net revenue divided by the number of days in the time period you are viewing.
Lightspeed eCom shows you 2 amounts: one with taxes included and the other with taxes excluded. |
| % of Visitors Placed Orders | This is a percentage value calculated by dividing the total number of placed orders by the number of unique visitors that visited your store within the time period you are viewing. |
| Total Net Revenue | This is the sum of net revenue for the time period you are viewing.
Lightspeed eCom shows you 2 amounts: one with taxes included and the other with taxes excluded. |